AHT
How long does an average customer conversation take, and where does handling time differ?
This Power BI dashboard combines average handling time (AHT), first-contact resolution (FCR), Net Promoter Score (NPS) and sales conversion. Together, they show the balance between efficiency, service quality and commercial performance.
Built by 77Insights with simulated data. No client data is used.
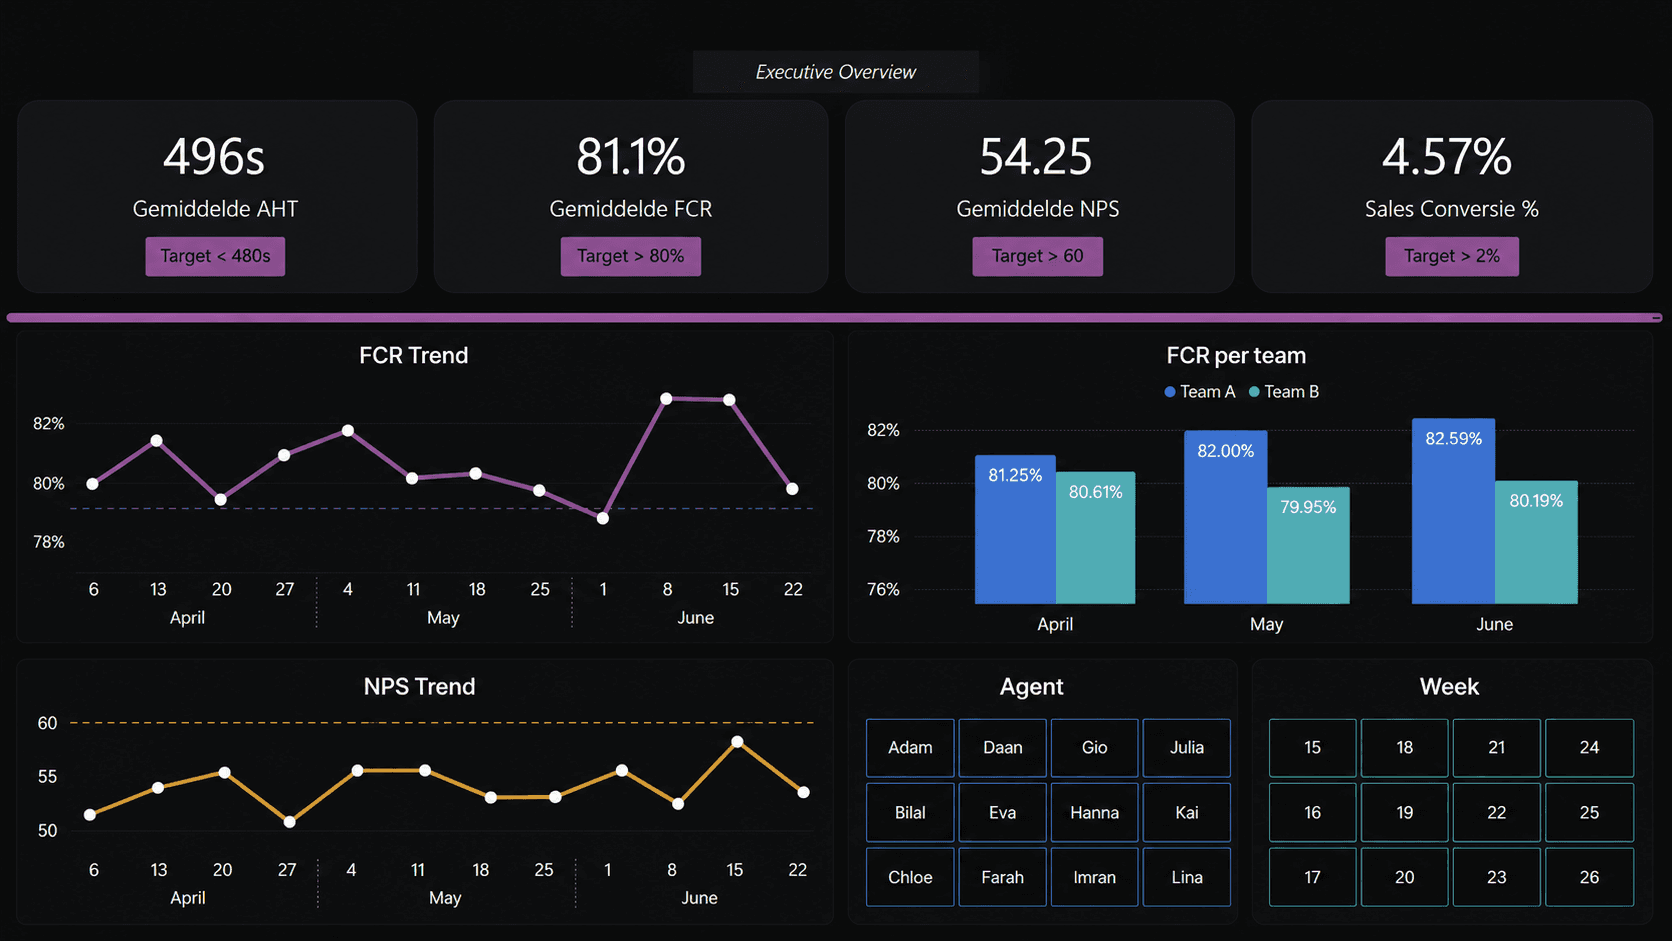
How long does an average customer conversation take, and where does handling time differ?
How often is the customer's question solved during the first contact?
How likely are customers to recommend the service, and how does that score change over time?
How often does a suitable offer lead to a sale?
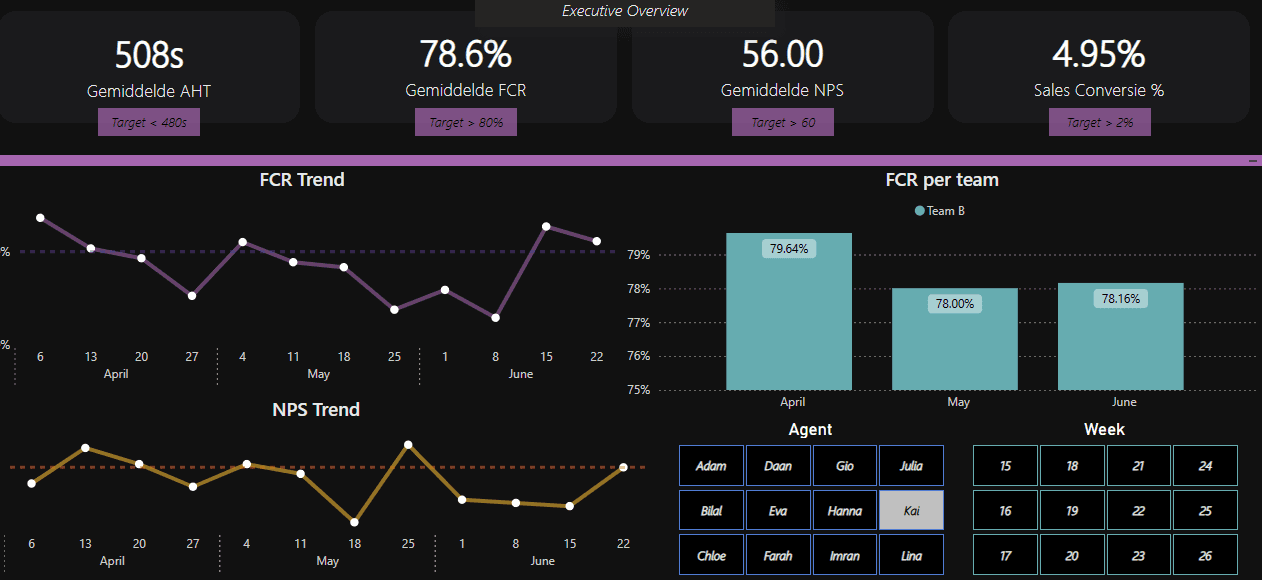
The filters update the figures and charts together. This makes it easier to prepare a team review without comparing several exports.

A low AHT is not automatically positive. If FCR or NPS falls at the same time, conversations may be ending too quickly. The dashboard makes those relationships easier to compare.
Show us what you use today. We will tell you honestly whether a dashboard would help.